Labor Education and
Research Center
We provide education, training, events, and applied research to
working people in Washington State.
Continued and Heightened Inequality Among Washington’s Post-Pandemic Workforce
By Muhammad Javid & David West, WA Labor Center and Michael Mulcahy, Working Title Research
Since March of 2020, the Washington Labor Education and Research Center has documented and analyzed the economic impact of the COVID-19 pandemic on Washington’s working families. On October 31st, 2022, the state of Washington formally ended the COVID state of emergency, but the economic costs to workers and our community will be long lasting. While overall employment has returned to pre-pandemic levels, and the unemployment rate has returned to historic lows, the pandemic is not over for our communities. Our analysis of summer 2022 employment data indicates that the pandemic built upon and exacerbated existing inequalities within the workforce. Specifically, the differentials in workforce participation and in unemployment rates between workers of different races, genders, ethnicities, and parental statuses have widened since before the pandemic.
Washington employers in 2022 experienced the tight labor market as an impediment to their return to profitability. Meanwhile, working families are suffering with thousands of potential workers on the sideline. Some workers are still outside the labor force, while others are still unable to find work. The needs of both workers and employers require us to look beyond the data top lines and examine racial and gender-based differences in worker experiences, to examine who has not yet returned to stable employment, and why.
Worker Experience and Data Limitations
Washington’s working people come from diverse backgrounds. The Labor Center aims to study current worker issues while also striving to make sure our diverse workforce is being represented in our discussion. The following analysis relies on Current Population Survey (CPS) data from the US Census Bureau and Bureau of Labor Statistics (BLS). This report drilled down into CPS data from the summer of 20221. CPS data provides a useful snapshot of Washington’s workforce before and after the formal pandemic crisis. Nonetheless, data does not speak for workers and places limits on our ability to capture every worker’s voice. We wanted to examine experiences of different subgroups of workers, but confronted issues of small sample sizes. To create statistically relevant samples we had to cluster groups of workers into six broad racial and ethnic categories. We acknowledge the limitations of this approach. The CPS collects data on binary sexes, making it impossible to examine the experiences of workers who are trans or gender nonconforming. For these reasons, the Labor Center held listening sessions with organizations representing the most impacted communities of workers, to inform our framing and understanding of worker experiences, as modeled by the Washington State Labor Council (WSLC) Racial Equity and Policy Toolkit2. We highlight further questions throughout this report that require continued discussions with affected workers.
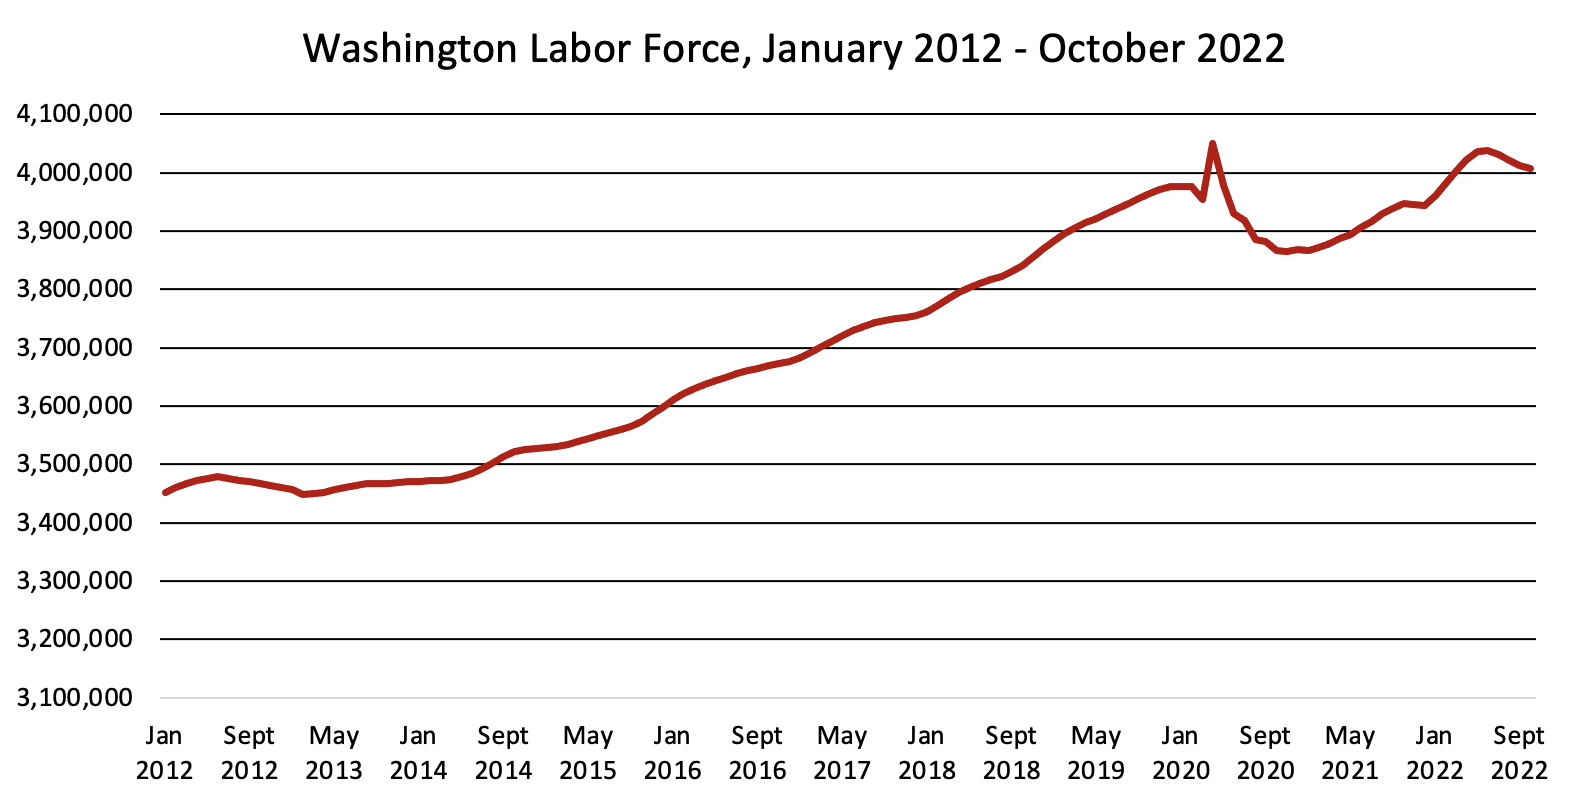
Massive Workforce Disruption, “Full Recovery” Yet to Come — Both workers and employers have experienced a mass disruption in the continuing COVID-19 economy. As of September 2022, the overall size of the Washington workforce had returned to pre-pandemic levels. However, the decade-long trend of yearly increases in the number of Washington workers has come to an unexpected halt. Some of the stalled growth in the size of the labor force derives from slowed population growth statewide; but some is because many workers remain “on the sidelines”, not having returned to the labor force. This halt has subverted employer expectations of hiring ability and has helped create a historically tight labor market.
Who’s In Our Workforce: Pandemic-Imposed Burdens Remain Heavy for Women
Many working people from different communities have been unable to reenter the workforce at pre-pandemic rates. Analyzing across race, gender, citizenship status, and parenthood allows us to understand which of our communities are still being hit the hardest by the pandemic nearly three years after the economic shutdown. Notably, the data supports our earlier report findings that Washington women continue to deal with unprecedented challenges, necessities, and obligations developed by the pandemic, which create obstacles to full workforce participation3.
- Women’s Workforce Participation Down— Historically, women’s participation in the workforce has been lower than that of men. The pandemic continues to exacerbate this pattern. In 2019, women had a workforce participation rate of 61%, compared to 73% for men. The most recent workforce participation rate for Washington women was 58%, compared to 71% for men. Women overall have experienced a 3-point drop in their rate of workforce participation, from 2019 to the third quarter of 2022, compared to a 2-point drop for men.
- Black Women Lead the Return to Work in Washington — The participation rate of Black workers in the workforce is now close to pre-pandemic levels at 67%4. Our analysis indicates that this return to pre-pandemic levels is led entirely by Black Women. Their current rate of participation in the workforce is a substantial 9-points higher than 2019, rising from 58% to 67%. Meanwhile, Black men’s workforce participation rate decreased from 76% in 2019 to 66%. It is also noteworthy that Black women experience the converse of the workforce participation trend that women overall experience, having a higher workforce participation rate now than before the pandemic.
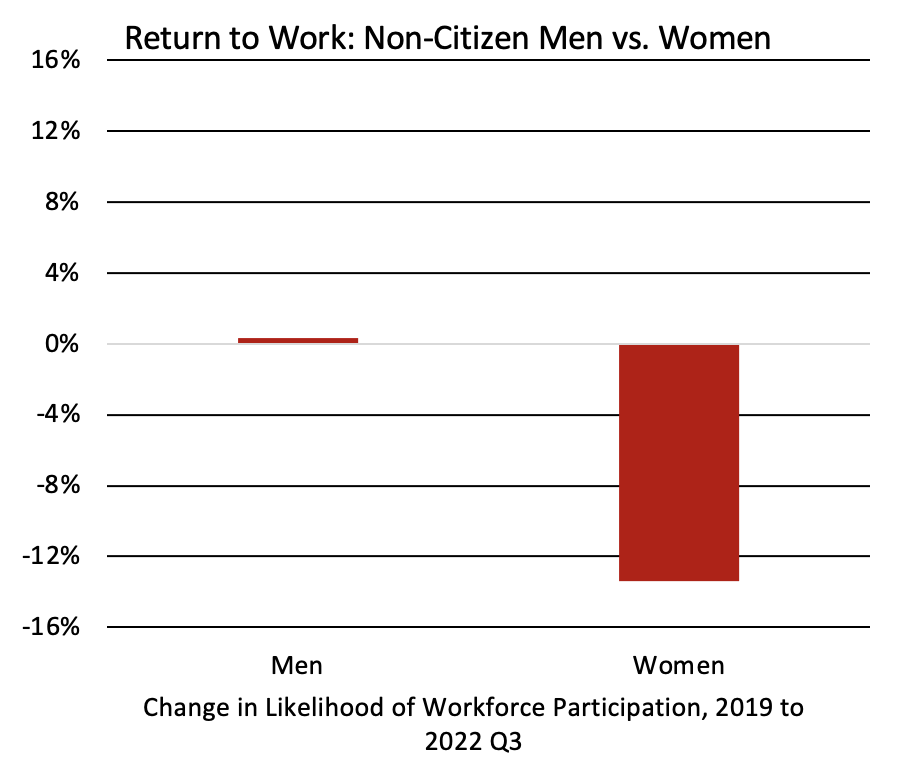
- Mass Departure of Immigrant Women from Workforce Continues — Among all citizenship statuses, non-citizen men have the highest likelihood of being in the workforce at 89%, the same rate as before the pandemic. Non-citizen women have the lowest likelihood of being in the workforce at 53%, compared to native-born and naturalized citizens in 2022. This is a drop of nearly 14 percentage-points from 2019. The large workforce participation discrepancy between non-citizen men and women warrants further research.
- Mothers With Small Children Still Out of Workforce — Parents of small children and adults without children have a similar likelihood of being in the workforce overall. We found a stark difference between male and female parents of small children. Men with small children are 94% likely to be in the workforce, reflecting little change from 20195. The likelihood for women with small children has dropped to only 58%. Women with small children experienced a 7-point drop in the likelihood of workforce participation, from 2019 to the third quarter of 20226. The likelihood of workforce participation for women with small children is 36 percentage-points less than men, as of summer 2022. This large difference continues to reflect the childcare and eldercare burdens that the pandemic has heightened, echoing the conclusions of our previous policy brief from March 20217.
Exploring Inequity in Unemployment
Among those within the workforce, many workers continue to face unemployment and are unable to attain jobs despite looking for work. Communities of color have historically faced higher rates of unemployment than the overall state average. Despite what has been called a historically tight labor market, there has existed a large unemployment gap between workers of color and White workers throughout the pandemic.
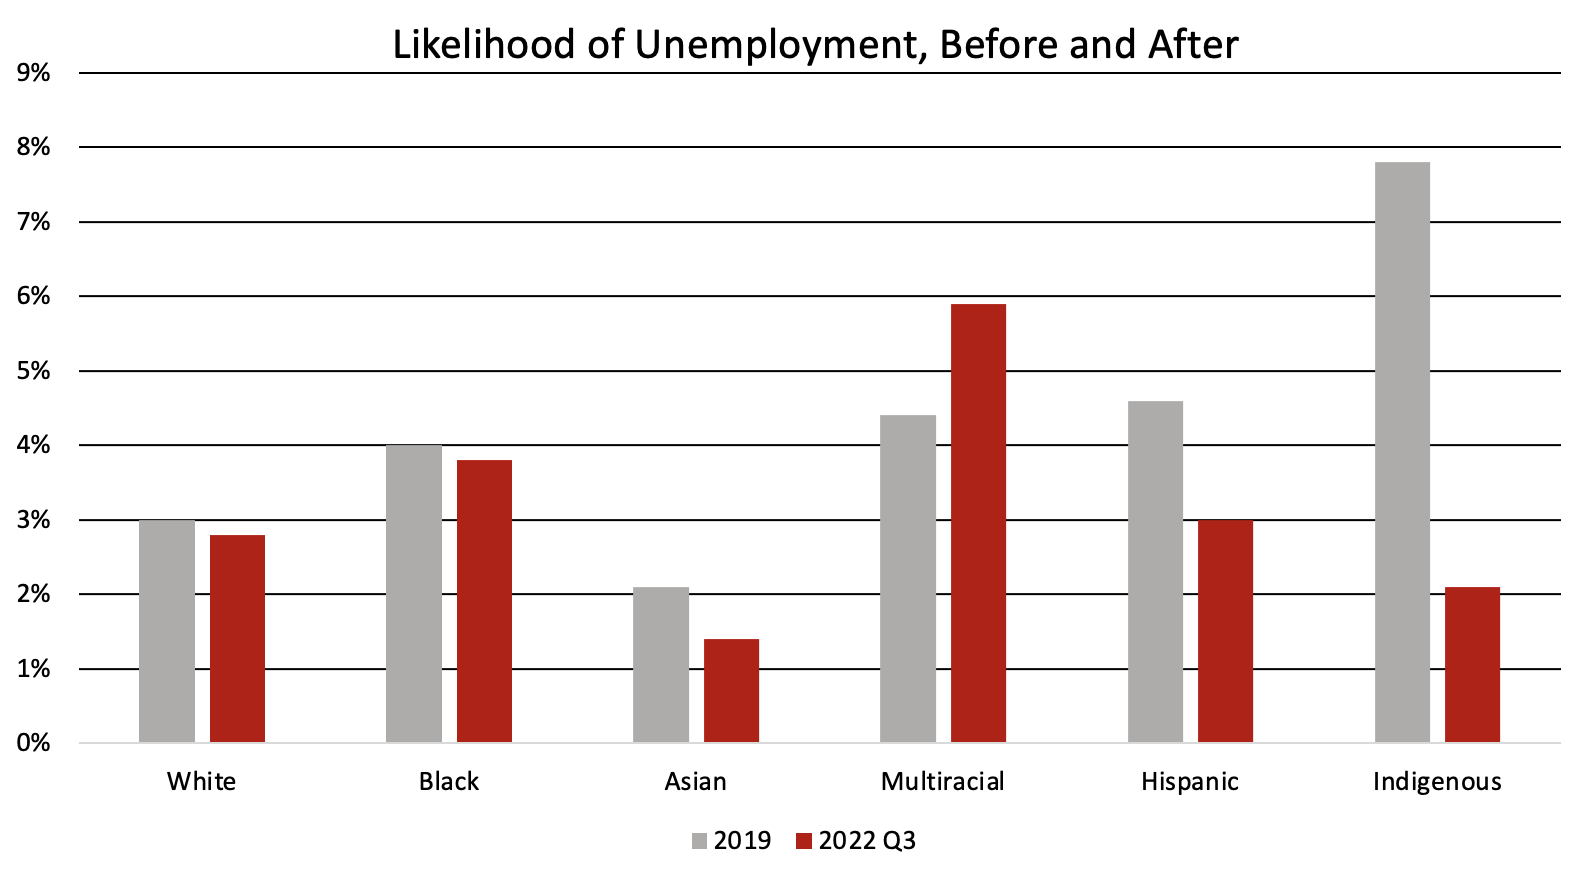
Diagnostic analyses indicate particularly large sampling error for Multiracial respondents for the month of September 2022. To address this problem, we increased the sample size by adding the basic monthly CPS data for June 2022, for these analyses. This change is further discussed at the end.
- Unemployment Down — Overall, the Washington unemployment rate dropped below pre-pandemic levels at 3.7% in September 2022, compared to 4.2% in September 20198.
- Racial Inequality in Unemployment Up — When we compare unemployment rates across racial/ethnic groups, the likelihood of unemployment for different groups has trended in different directions. Multiracial workers experienced the largest and only increase in likelihood of unemployment, going from 4.4% in 2019 to 5.9% in summer 2022. Black workers’ unemployment likelihood was the next highest, albeit close to the state average at 3.8%. The likelihood of unemployment for White, Asian, Hispanic, and Indigenous workers remained under 3%, below the state average.
Racial Differentials In Unemployment Persist Across Education Levels:
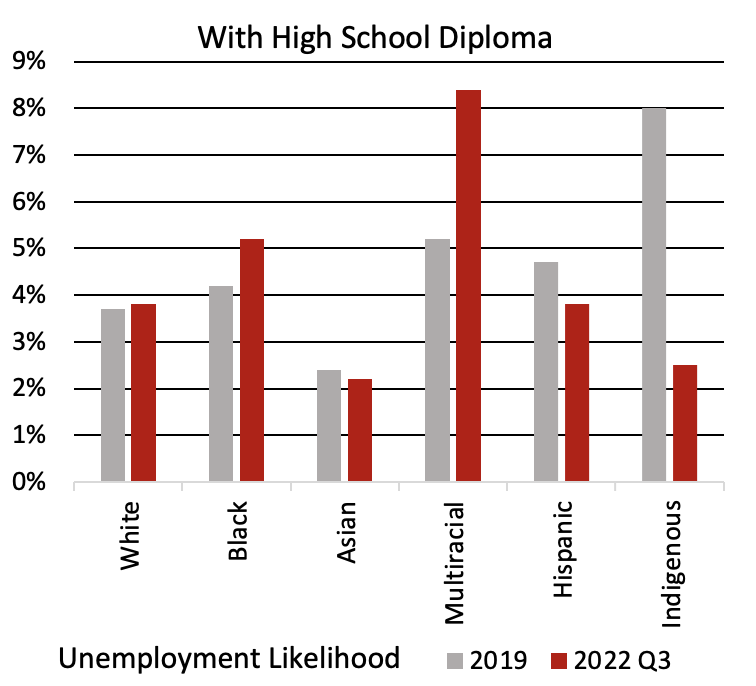
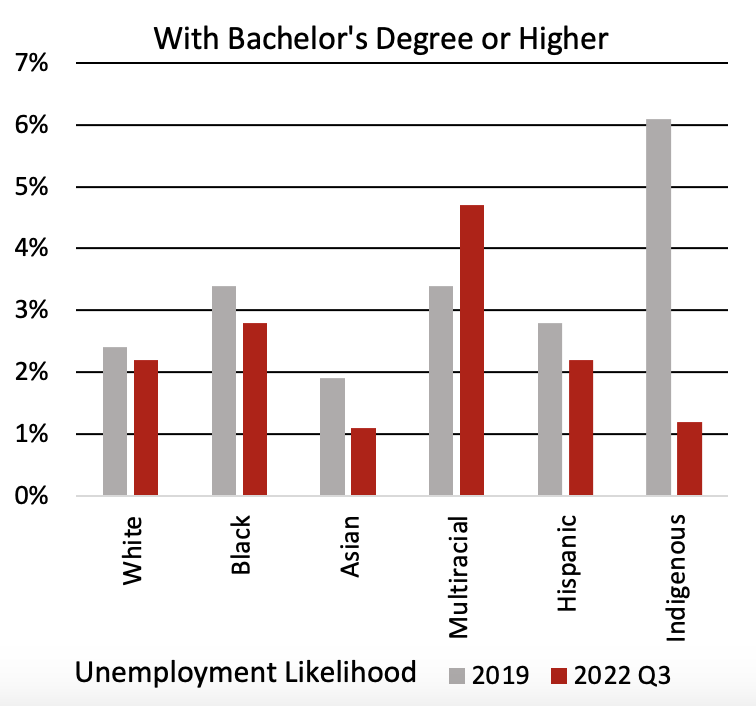
- Multiracial Workers Disproportionately More Likely to Be Unemployed — Among high school graduates, the likelihood for unemployment is the highest for Multiracial workers at 8.4%. This is about a 3-point increase from the pre-pandemic level of 5.2%. Among holders of a 4-year college degree or higher, multiracial workers also see an increase in the likelihood of being unemployed, from 3.4% in 2019 to 4.7% in summer 2022. All other racial/ethnic groups experienced a decrease in the likelihood of being unemployed.
- Black Workers Disproportionately More Likely to Be Unemployed — Black high school diploma holders experience an unemployment likelihood of 5.2%, well above the state average. This is a one-point increase from the pre-pandemic level of 4.2% for these workers. Among those with a high school diploma, Black and Multiracial workers were the only groups to experience an increase in likelihood of unemployment by the summer of 2022, compared to before the pandemic.
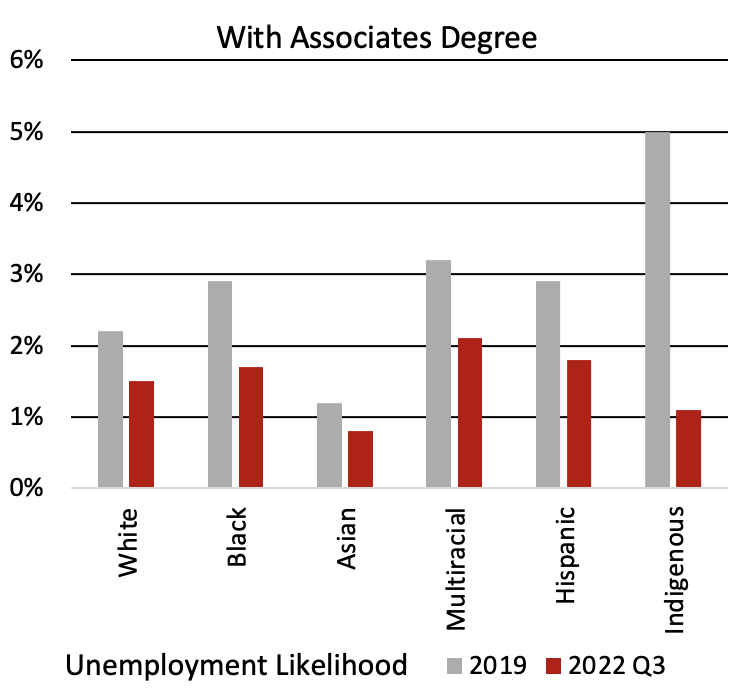
- Indigenous Workers Less Likely to Be Unemployed — Indigenous workers experienced an overall unemployment likelihood of 2.1% in Summer 2022, down from 7.8% in 2019. This trend is consistent across education levels. Indigenous high school diploma holders experienced a sharp drop in likelihood of unemployment, from 8% in 2019 to 2.5% in summer 2022. Similarly, the likelihood of unemployment for Indigenous 4-year degree holders dropped from 6.1% in 2019, to 1.2% in summer 2022.
- Associates Degree Holders Faring Better — Overall, the likelihood of unemployment for workers with associates degrees has fallen from 2.3% in 2019 to 1.5% in the third quarter of 2022. Associates degree holders from every racial/ethnic background experienced a decrease in the likelihood of unemployment, going from 2019 to summer 2022.
Back to Data Limitations
Two findings noted above stand out to us and need more research. The CPS data shows a sharp drop in the likelihood of unemployment of Indigenous workers, and an increase among Multiracial workers. These results may be exaggerated by the issue of small sample size and sampling error. However, these results likely also reflect concentrations of different worker demographic groups in occupations and industries that have been faster or slower to recover. Further research into these findings is necessary, which is informed and conducted by organizations of affected communities9.
In Pursuit of an Equitable and Full Recovery
Our key findings indicate that while Washington’s workforce size and unemployment rate have largely recovered to pre-pandemic levels, the pandemic has also exacerbated differences among workers based on race, gender, citizenship status, and parenthood.
Mothers of small children and immigrant women continue to remain on the sidelines of our economy, likely due to the ongoing family care needs examined in a previous Labor Center policy brief10. With the COVID-19 pandemic placing elders at higher risk and children often staying at home for school due to distance learning or COVID exposure and quarantine procedures, many women have had to prioritize family responsibility over return to work.
Black and Multiracial workers continue to experience disproportionate likelihoods of unemployment while actively looking for work, a trend that was further compounded by pandemic conditions. Black workers with 4-year degrees or higher were less likely to be unemployed in summer 2022 than before the pandemic, but were still more likely to be unemployed than degree holders of other races. Black and Multiracial high school graduates’ likelihood of unemployment actually increased from 2019 to summer 2022; high school graduates of other races were less likely unemployed than pre-pandemic. Taken together, this data reveals that the pandemic not only worsened Black and Multiracial economic outlook, but exacerbated employment inequities.
The CPS data we used does not allow us to look in detail at the employment trends of trans, nonbinary, gender-nonconforming, nor LGBTQ workers during the pandemic era. It is critical that public agencies expand data collection and analysis among LGBTQ workers, especially those from communities of color. The LGBTQ Movement Advancement Project states:
Although data collection efforts play a central role in government decision-making and resource allocation, LGBTQ people largely remain invisible to local, state, and federal officials who make decisions that directly affect their safety and wellbeing11.
There is immense worker experience that lies behind our findings sourced from CPS data. The data alone does not allow us to explain why the trends we observed have taken place. It does confirm that by the end of 2022, the return to “full employment” and the end of the formal public health emergency, our communities have not seen economic recovery. Families continue to face exacerbated challenges which keep workers at home. Conversely, businesses struggle to find workers, often blaming the tight labor market for the lack of job applicants.
To attract workers back into the workforce, businesses and policymakers must use an equitable recovery approach that considers the pandemic’s impacts on all of Washington’s workers, addressing the many ways the pandemic has heightened existing inequities. We need further qualitative research to identify the precise barriers to reemployment faced by our communities with a focus on the experiences of Black men, Multiracial workers, immigrant women, and mothers of young children. They comprise communities of workers that have been disproportionately impacted by the pandemic. Only with this detailed information, and policies which specifically target each barrier identified, can we move toward an equitable recovery for Washington workers, and a robust workforce for frustrated employers.
Endnotes
1We have analyzed CPS data from the third quarter (July – September) of 2022. Methods are further discussed at the end.
2https://www.wslc.org/racial-equity-toolkit/
3“Washington Workers in the Pandemic”, https://georgetown.southseattle.edu/sites/georgetown.southseattle.edu/files/inline-files/LERC%20Policy%20Brief%20on%20PULSE%20Data%203-30-21.pdf
4The 2019 workforce participation of Black workers was 68%.
5The likelihood of workforce participation for men with small children in 2019 was 95%. In 2022 Q3 it was 94%.
6The likelihood of workforce participation for women with small children in 2019 was 65%. In 2022 Q3 it was 58%.
7“Washington Workers in the Pandemic”, https://georgetown.southseattle.edu/sites/georgetown.southseattle.edu/files/inline-files/LERC%20Policy%20Brief%20on%20PULSE%20Data%203-30-21.pdf
8Seasonally adjusted state averages from Washington State Employment Security Department (ESD)
9https://www.wslc.org/racial-equity-toolkit/
10“Washington Workers in the Pandemic”, https://georgetown.southseattle.edu/sites/georgetown.southseattle.edu/files/inline-files/LERC%20Policy%20Brief%20on%20PULSE%20Data%203-30-21.pdf
11https://www.lgbtmap.org/policy-and-issue-analysis
Notes on Methodology
Community Conversations
The Labor Center held listening sessions with local worker organizations that informed us of our approach to this report. Those groups included A. Philip Randolph Institute Seattle Chapter, Coalition of Black Trade Unionists Puget Sound Chapter, Drivers Union, Joan Jones/TLGBQ+ Workers Center, and the Washington State Labor Council, AFL-CIO Racial and Gender Justice Committee.
Data Overview
We have analyzed CPS data from the third quarter (July – September) of 2022, with comparisons to (January – December) 2019 data. The 3rd quarter data we have analyzed is not reflective of the entirety of 2022, due to seasonal labor market shifts, progress of pandemic recovery, and small sample sizes. Differentials with data from all of 2022 are inevitable. The basic monthly CPS data used here are based on probability sampling methods designed to generate a representative sample of the population of the U.S. as well as each of the 50 states. After applying the recommended survey weights, the data are broadly representative of the non-institutionalized population of Washington state, but the analyses are subject to the usual limitations imposed by state-level sample data. Our analyses of 2019 and the 3rd quarter of 2022 are based on pooled monthly samples from January through December of 2019, and August through October of 2022, respectively. Our discussion of the likelihood of participation in the workforce and unemployment is based on separate logistic regression analyses of workforce participation and unemployment on the following independent variables: age group, race/ethnicity, sex, educational attainment, citizenship status, parental status, and metro area residence. The unemployment regressions also include controls for employment in key industries: construction, retail sales, transportation and warehousing, hospitality and leisure, and other services. Our discussion focuses on differences that are statistically significant at probability level of 0.05.
Racial/Ethnic Categorization
The original “race” variable measured in the CPS consists of 23 racial categories. A separate “Hispanic Origin” variable consists of 8 different Hispanic origin categories and a “not Hispanic” category. For the purposes of this report, both of these variables were merged into one “Race/Ethnicity” variable, consisting of 6 mutually exclusive, exhaustive categories: White, Black, Asian, Multiracial, Hispanic, and Indigenous. Hispanic respondents were coded as such, regardless of any other racial selection. Our “Indigenous” aggregate category combines the “American Indian/Aleut/Eskimo only” and the “Hawaiian/Pacific Islander only” categories of the original race variable. The “Multiracial” aggregate category includes 18 categories representing different combinations of racial backgrounds (e.g. White-Asian, Black-Asian, White-Black-Asian, Black-American Indian, White-Black-Hawaiian/Pacific Islander”, etc.).
Sample Period Exception
For analyses of unemployment among Multiracial workers we have included the month of June to the third quarter CPS sample of 2022. This change was made to correct for anomalously high unemployment rates among Multiracial workers in the September CPS sample for Washington state. We believe that the higher rate of unemployment likelihood was largely attributable to sampling error resulting from a small sample size and the distribution of Multiracial workers in industries that faced a high rate of unemployment that month. Broadening the sample to include June provides a more accurate analysis of the likelihood of unemployment for Multiracial workers.

About the Washington State Labor Education and Research Center
The Labor Center delivers high-quality education, training programs and research for the working people of Washington State. As a unique program within higher education, we use the best practices of adult education and applied research to serve our dynamic and diverse labor force, including the new Rights at Work Washington website (www.RightsatWorkWA.org).
